
This post explains how to add a category column to a pandas DataFrame with cut().
cut makes it easy to categorize numerical values in buckets.
Let’s look at a a DataFrame of people and categorize them into “child”, “teenager”, and “adult” buckets based on their age.
Simple example
Suppose you have the following DataFrame.
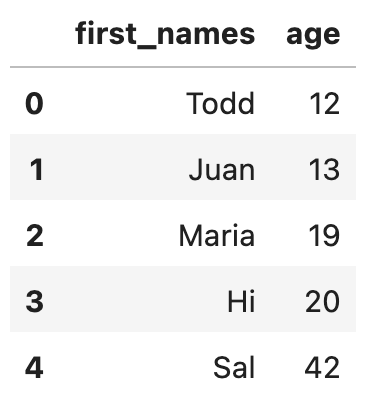
Here’s the code to create the DataFrame.
import pandas as pd
import numpy as np

df = pd.DataFrame(
    {"first_names": ["Todd", "Juan", "Maria", "Hi", "Sal"], "age": [12, 13, 19, 20, 42]}
)
Add an age_bins column to the DataFrame that categorizes the people into these buckets: child, teenager, or adult.
df["age_bins"] = pd.cut(
    x=df["age"],
    bins=[1, 12, 19, np.inf],
    labels=["child", "teenager", "adult"],
)
Here’s what the resulting DataFrame contains.
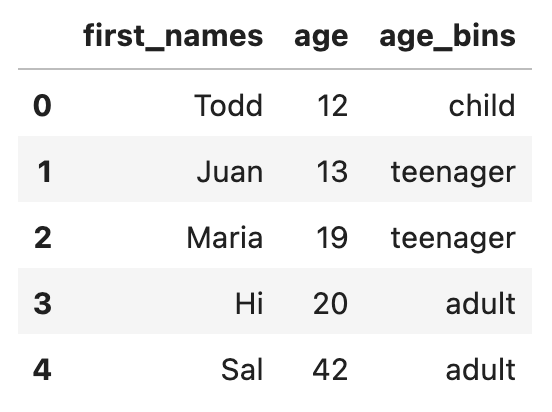
The rightmost value is inclusive in the bins argument, so the buckets are 1-12, 13-19, and 20-infinity.
dtypes
Let’s inspect the dtypes of the resulting DataFrame.
df.dtypes
first_names      object
age               int64
age_bins       category
dtype: object
You can see that age_bins is a category column.
When to use cut
You can use cut when building features for model training.
You may want to train a machine learning model based on bucket labels, not actual numerical values. cut makes it really easy for you to transform a numerical value into categories.
Conclusion
cut is a convenient way to convert a numerical column into different value buckets.
You’ll find it especially useful when feature engineering.
Comments are closed, but trackbacks and pingbacks are open.